Description
Trading With Correlation
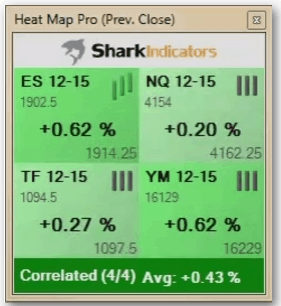
The SIHeatMap provides a quick, simple, & easy to read visual display of the current market conditions. This game changing tool will also inform you when the major markets (or your instruments of choice) are all correlated in the same direction or mixed. Know at a glance when follow through is high, or when the markets are choppy.
As an added feature, SIHeatMap includes Trend Bars that display the status of the last three bars for each market. Since our custom HeatMap opens in its own compact window, you won’t have to give up valuable real estate to another over-sized indicator. Always know where the action is, with SIHeatMap Pro!


Reviews
There are no reviews yet.